SRE · Alerting
Stop paging on CPU.Page on what users feel, as fast as they feel it.
Dozens of CPU and disk pages a week, almost none needing action, and the one real outage paged late. This is the fix the Google SRE Workbook recommends: SLOs, error budgets and multiwindow, multi-burn-rate alerts, built in Prometheus.
Picture the on-call week. A node hits 90% CPU at 2 am, and the pager goes off. A disk crosses 80%, and it goes off again. Nobody does anything, because users are fine. Then last month checkout really broke, and the first page came long after customers had noticed.
The team wants alerts tied to what users feel. This article walks through how to get there, with one everyday picture to hold it together: a monthly mobile data plan. You have an allowance for the month. You don't need a buzz every time an app downloads something. You need a warning when you are using data so fast that you will run out before the month ends.
01 / The problem
Why do CPU pages fail in both directions?
Because CPU is a cause, and pages should be about symptoms. The SRE book frames monitoring as two questions: "what's broken, and why?" The "what" is the symptom. The "why" is a cause. [5] Its example table pairs "My responses are slow" with a cause like CPUs overloaded by a bad sort. [5]
High CPU fails you twice. It fires when users are fine, because a busy node that still answers fast is not a problem anyone feels. And it stays silent when users suffer for reasons CPU never sees, such as a broken dependency or a deploy that fails fast.
The book sets a high bar for a page. "Every page should be actionable." And "If a page merely merits a robotic response, it shouldn't be a page." Its advice is to spend "much more effort on catching symptoms than causes", and for causes, to "only worry about very definite, very imminent causes". [5]
- In the data plan
- A buzz every time an app uses the network. It is busy, but it can't tell you whether you will run out this month.
- In the system
- A page every time CPU or disk crosses a line. It describes a cause, not whether users are getting errors or slow answers.
02 / The indicator
What should you measure instead?
A service level indicator (SLI): "a carefully defined quantitative measure of some aspect of the level of service that is provided". [4] The Workbook recommends one shape for every SLI: the number of good events divided by the total number of events. That gives a number from 0% (nothing works) to 100% (nothing is broken). [2]
For a request-driven service, the two to start with are: [2]
- Availability: the proportion of requests that got a successful response. In the Workbook's example, 5XX responses count against the SLO and everything else counts as success.
- Latency: the proportion of requests faster than a threshold.
Note that latency is a proportion too, not an average. The SRE book warns that an average can hide the slow tail, and prefers percentiles to the mean. [4] The Workbook suggests more than one latency grade, such as 90% of requests faster than 100 ms and 99% faster than 400 ms. [2]
The Workbook's worked example measures at the load balancer, which sits closer to the user than application logs, and advises a first SLI that needs the least engineering work. [2]
- In the data plan
- The one number that matters: gigabytes used so far against the allowance.
- In the system
- Good requests divided by all requests, for errors and for speed.
03 / The target
How good is good enough?
A service level objective (SLO) is "a target value or range of values for a service level that is measured by an SLI". [4] For example, 99.9% of checkout requests succeed over a rolling window.
This is a business decision, not just an engineering one. The SRE book says choosing targets "is not a purely technical activity because of the product and business implications". [4] The Workbook says the SLO should be owned by someone empowered to trade feature speed against reliability: often the CTO in a small company, and normally the product owner in a larger one. [2] It lists three people who must agree: [2]
- Product managers agree the threshold is good enough for users.
- Developers agree to reduce risk to users when the budget is exhausted.
- The team defending the SLO agrees it is defensible "without Herculean effort".
Some practical rules from both books:
- 100% is the wrong target. Each extra nine costs more while the benefit to customers "steadily approaches zero". [2]
- Start from data, then iterate. The SRE book warns against picking a target from current performance alone. [4] The Workbook agrees but says current performance is a fine start if you have nothing else and a process to refine it. [2]
- Prefer a loose target you tighten later. "It's better to start with a loose target that you tighten than to choose an overly strict target that has to be relaxed". [4]
- Pick a window. The Workbook found "a four-week rolling window to be a good general-purpose interval", because a whole number of weeks always holds the same number of weekends. [2]
The arithmetic below uses 30 days, because that is what the Workbook's alerting chapter uses. [1] The method is the same for 28 days.
- In the data plan
- Choosing the plan size with whoever pays the bill, then adjusting it after a few months of real use.
- In the system
- Agreeing the SLO with product, development and operations, writing it down, and reviewing it.
04 / The allowance
What is an error budget for?
The error budget is 100% minus the SLO. [2] With a 99.9% SLO, the budget is 0.1% of requests. The Workbook's example: 3 million requests over four weeks gives a budget of 3,000 errors, so a single outage that causes 1,500 errors costs 50% of it. [2]
In time, a full outage at 99.9% over 30 days uses the whole budget in about 43 minutes. The Workbook's burn-rate table gives exactly that figure. [1]
A budget only matters if something happens when it runs out. That is the error budget policy: a written document saying what actions are taken, and by whom, when the budget is spent. [2] The Workbook's example policy halts all changes and releases, except P0 issues or security fixes, until the service is back within its SLO. It also requires a postmortem when a single incident uses more than 20% of the four-week budget. [3]
- In the data plan
- The allowance itself, plus the house rule: blow it, and no new streaming apps until next month.
- In the system
- The allowed bad requests, plus a policy that shifts work to reliability when they are used up.
05 / The trap
Why is a plain error-rate alert noisy or slow?
Once you have an SLO, the obvious alert is "page if the error rate is above 0.1%". The Workbook judges every alerting strategy on four measures: [1]
| Measure | Meaning |
|---|---|
| Precision | The proportion of events detected that were significant. |
| Recall | The proportion of significant events detected. |
| Detection time | How long it takes to send a notification. |
| Reset time | How long alerts keep firing after the issue is resolved. |
A "significant event" is one that "consumes a large fraction of the error budget". [1] Now look at the simple options the Workbook tries first:
- Error rate over 10 minutes at or above the SLO. Fast, with good recall, but low precision. A 0.1% error rate for 10 minutes pages while using only 0.02% of the monthly budget. You could get up to 144 alerts a day, act on none, and still meet the SLO. [1]
- A longer window, such as 36 hours. Better precision, but a very poor reset time: after a full outage the alert keeps firing for the next 36 hours. Long windows are also more expensive to compute. [1]
-
A short window plus a
for:duration of 1 hour. Poor recall and poor detection time. A 100% outage pages after one hour, the same as a 0.2% outage, and by then has used 140% of the 30-day budget. An error rate that dips back under the line resets the timer, so a flapping service may never page. The Workbook does not recommend durations for SLO alerts. [1]
- In the data plan
- Warning whenever today's usage is above the daily average: you'd be warned most days and still finish the month fine.
- In the system
- Alerting whenever the error rate tops the SLO: many pages that never threaten the budget.
06 / The speed
What is a burn rate?
Burn rate is "how fast, relative to the SLO, the service consumes the error budget". [1] A burn rate of 1 uses exactly the whole budget by the end of the window. For a 99.9% SLO over 30 days, a steady 0.1% error rate is a burn rate of 1. [1]
| Burn rate | Error rate | Budget gone in |
|---|---|---|
| 1 | 0.1% | 30 days |
| 2 | 0.2% | 15 days |
| 10 | 1% | 3 days |
| 1,000 | 100% | 43 minutes |
The arithmetic is simple. Burn rate is the error rate divided by the budget fraction. The budget lasts the window divided by the burn rate. And the share of budget spent by the time an alert fires is: [1]
budget spent = burn rate × alert window ÷ SLO periodSo you turn it around. Decide how much budget is worth waking someone for, pick a window, and solve for the burn rate. Over a 30-day period of 720 hours:
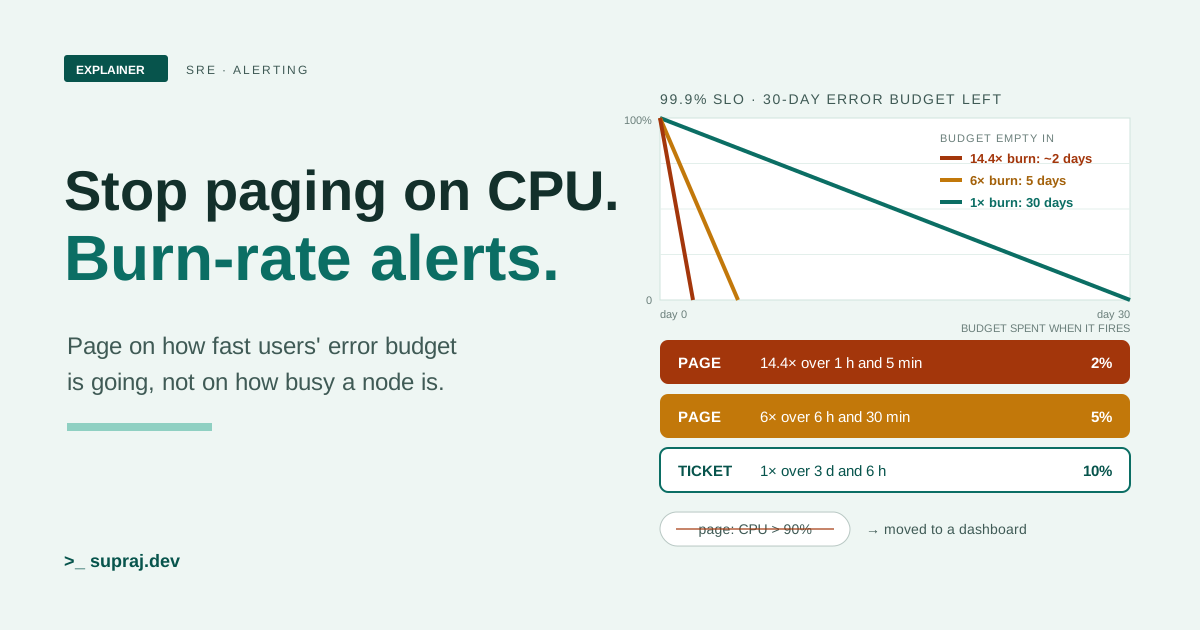
2% of budget in 1 hour:   0.02 × 720 ÷ 1  = 14.4  → page if error rate > 14.4 × 0.1% = 1.44%
5% of budget in 6 hours:  0.05 × 720 ÷ 6  = 6     → page if error rate > 6 × 0.1%    = 0.6%
10% of budget in 3 days:  0.10 × 720 ÷ 72 = 1     → ticket if error rate > 0.1%
Those are the Workbook's recommended starting numbers: 2% in one hour and 5% in six hours for paging, and 10% in three days as a baseline for tickets. [1] A burn of 14.4 empties the budget in 50 hours (720 ÷ 14.4). A burn of 6 empties it in 5 days. Either is worth a page. A burn of 1 gives you the whole month, which is ticket speed.
The Workbook says a single 1-hour alert at 36 times burn has low recall: a 35 times burn never fires, yet empties the budget in 20.5 hours. [1] That is why there are several tiers, not one.
- In the data plan
- Using 14.4 days' worth of data in a single day. Keep that up and the month's allowance is gone in about two days.
- In the system
- A 1.44% error rate on a 99.9% SLO: burn rate 14.4, budget empty in 50 hours.
07 / The recommended design
Why does each alert need two windows?
Multiple burn rates fix recall, but long windows still have slow reset times. The Workbook's final design adds a short window to each tier, to check that the budget is "still being consumed" when the alert fires. Its guideline is to make the short window 1/12 of the long one. [1] Both windows must be over the threshold. This is approach 6, which the Workbook calls "the most viable and most highly recommended option". [1]
| Severity | Long window | Short window | Burn rate | Budget consumed |
|---|---|---|---|---|
| Page | 1 hour | 5 minutes | 14.4 | 2% |
| Page | 6 hours | 30 minutes | 6 | 5% |
| Ticket | 3 days | 6 hours | 1 | 10% |
The short window is what fixes reset time. The Workbook's example: after 15% errors for 10 minutes, the alert starts firing about 5 minutes in. Once the errors stop, the short window drops below the threshold 5 minutes later and the alert stops. The long window alone stays over the line until 60 minutes after the errors stop. [1]
The Workbook's example configuration also shows an optional middle ticket tier: a burn of 3 over 24 hours, with a 2-hour short window. [1]
Try it on a few incidents. The numbers assume the error rate jumps at time zero, traffic stays steady, and scrape and evaluation delays are ignored.
Figure 1 · What fires, and when, for a 99.9% SLO over 30 days
| Rule | Fires above | Result | Budget spent when it fires |
|---|---|---|---|
| Old rule: 10 min error rate ≥ 0.1% | 0.1% | - | - |
| Page: 14.4× over 1 h and 5 min | 1.44% | - | - |
| Page: 6× over 6 h and 30 min | 0.6% | - | - |
| Ticket: 1× over 3 d and 6 h | 0.1% | - | - |
Pick an incident. Each button sets a steady error rate and shows which rules fire, how quickly, and how much of the month's budget is gone by then.
Two things stand out. The old rule pages within minutes for 0.3% errors, which leave 10 days of budget: that is ticket work. And it treats every incident the same, while the burn-rate tiers page in under a minute for a full outage and wait hours for a slow leak. Urgency follows how fast the budget is going.
One cost: when a big outage trips several tiers, you get several notifications unless you suppress them. The Workbook calls this out. [1] Chapter 8 shows one way.
- In the data plan
- Before warning you, the phone checks the last hour and the last five minutes. A download that already finished stops the warning quickly.
- In the system
- Each tier needs both a long and a short window over the threshold, so the alert clears soon after the fix.
08 / The playbook
How do you build it in Prometheus?
Two kinds of rules do the work. Recording rules "precompute frequently needed or
computationally expensive expressions and save their result as a new set of time
series". Alerting rules turn an expression into alerts. Both live in YAML rule files
loaded through rule_files, inside rule groups that run at a regular
interval. [6]
Step 1: record the error ratio for every window
The example uses a checkout service and a counter http_requests_total with a
code label. Swap in your own metric and job. The names follow Prometheus's
level:metric:operations convention and the Workbook's examples.
[10] [1]
# slo-checkout.rules.yml
groups:
  - name: slo-checkout-recording
    rules:
      - record: job:slo_errors_per_request:ratio_rate5m
        expr: |
          sum by (job) (rate(http_requests_total{job="checkout", code=~"5.."}[5m]))
          /
          sum by (job) (rate(http_requests_total{job="checkout"}[5m]))
      - record: job:slo_errors_per_request:ratio_rate30m
        expr: |
          sum by (job) (rate(http_requests_total{job="checkout", code=~"5.."}[30m]))
          /
          sum by (job) (rate(http_requests_total{job="checkout"}[30m]))
      - record: job:slo_errors_per_request:ratio_rate1h
        expr: |
          sum by (job) (rate(http_requests_total{job="checkout", code=~"5.."}[1h]))
          /
          sum by (job) (rate(http_requests_total{job="checkout"}[1h]))
      - record: job:slo_errors_per_request:ratio_rate6h
        expr: |
          sum by (job) (rate(http_requests_total{job="checkout", code=~"5.."}[6h]))
          /
          sum by (job) (rate(http_requests_total{job="checkout"}[6h]))
      - record: job:slo_errors_per_request:ratio_rate3d
        expr: |
          sum by (job) (rate(http_requests_total{job="checkout", code=~"5.."}[3d]))
          /
          sum by (job) (rate(http_requests_total{job="checkout"}[3d]))
Three details here come from the Prometheus docs:
-
Take
rate()first, thensum. Otherwiserate()"cannot detect counter resets when your target restarts". [8] - Sum the numerator and denominator separately, then divide. Don't average ratios, which "is not statistically valid". [10]
-
dis a valid duration unit, so[3d]works. [14] It reads three days of samples on every evaluation, the cost the Workbook warns about for long windows. [1]
For a latency SLI, count requests under the threshold. With a classic histogram, the Prometheus docs give this shape for "served within 300 ms", and warn that it needs a bucket boundary at exactly 0.3. Without one, no result is returned at all. [11]
  sum by (job) (rate(http_request_duration_seconds_bucket{le="0.3"}[5m]))
/
  sum by (job) (rate(http_request_duration_seconds_count[5m]))
That gives the good ratio. Record 1 - (that) as the slow ratio, and compare it
with your latency budget. For a 99% latency SLO the budget is 0.01, so the thresholds
become 14.4 × 0.01 and 6 × 0.01.
Step 2: write the page and ticket alerts
This follows the Workbook's expression, with one alert for both page tiers and one for
the ticket. [1] There is no for: clause, so an
alert becomes active on the first evaluation where its condition is true.
[7]
  # second group in the same slo-checkout.rules.yml
  - name: slo-checkout-alerts
    rules:
      - alert: CheckoutErrorBudgetBurn
        expr: |
          (
            job:slo_errors_per_request:ratio_rate1h{job="checkout"} > (14.4 * 0.001)
          and
            job:slo_errors_per_request:ratio_rate5m{job="checkout"} > (14.4 * 0.001)
          )
          or
          (
            job:slo_errors_per_request:ratio_rate6h{job="checkout"} > (6 * 0.001)
          and
            job:slo_errors_per_request:ratio_rate30m{job="checkout"} > (6 * 0.001)
          )
        labels:
          severity: page
        annotations:
          summary: "{{ $labels.job }} is burning its error budget fast"
      - alert: CheckoutErrorBudgetSlowBurn
        expr: |
          job:slo_errors_per_request:ratio_rate3d{job="checkout"} > 0.001
          and
          job:slo_errors_per_request:ratio_rate6h{job="checkout"} > 0.001
        labels:
          severity: ticket
        annotations:
          summary: "{{ $labels.job }} is slowly burning its error budget"
Why this works: and keeps left-hand elements only where the right-hand side
has a matching label set, and or adds right-hand elements not already
there. The two recorded series differ in name but share job, so they
match. and binds tighter than or; the brackets just make that
plain. [9]
Step 3: stop one outage from sending three notifications
Prometheus alerting rules are "not a fully-fledged notification solution". Silencing,
rate limiting and alert dependencies belong to Alertmanager.
[7] An inhibition rule mutes a target alert while a source
alert exists, when the labels in equal match.
[13]
# alertmanager.yml (excerpt)
inhibit_rules:
  - source_matchers:
      - 'severity = "page"'
    target_matchers:
      - 'severity = "ticket"'
    equal: [job]
Step 4: check and test before you ship
promtool check rules checks a rule file's syntax without starting a server.
It exits 0 when the file is valid and 1 on errors. [6]
promtool test rules runs unit tests against fake series.
[12] A test that a 50% error rate pages, and a clean
service doesn't:
# slo-checkout.test.yml
rule_files:
  - slo-checkout.rules.yml
evaluation_interval: 1m
tests:
  - interval: 1m
    input_series:
      - series: 'http_requests_total{job="checkout", code="200"}'
        values: '0+100x120'
      - series: 'http_requests_total{job="checkout", code="500"}'
        values: '0+100x120'
    alert_rule_test:
      - eval_time: 60m
        alertname: CheckoutErrorBudgetBurn
        exp_alerts:
          - exp_labels:
              severity: page
              job: checkout
            exp_annotations:
              summary: "checkout is burning its error budget fast"
  - interval: 1m
    input_series:
      - series: 'http_requests_total{job="checkout", code="200"}'
        values: '0+100x120'
      - series: 'http_requests_total{job="checkout", code="500"}'
        values: '0+0x120'
    alert_rule_test:
      - eval_time: 60m
        alertname: CheckoutErrorBudgetBurn
        exp_alerts: []
promtool check rules slo-checkout.rules.yml
promtool test rules slo-checkout.test.yml
In the test file, '0+100x120' means start at 0 and add 100 at each of 120
further samples. [12] Leaving exp_alerts empty
asserts that the alert does not fire. [12] Run both commands
in CI on every change to the rules.
09 / The edge case
What if the service gets little traffic?
Then one failed request can look like a disaster. The Workbook's example: at 10 requests an hour, one failure is a 10% hourly error rate. On a 99.9% SLO that is a 1,000 times burn, and it pages straight away. [1] Its options: [1]
- Generate artificial traffic, such as probers. The catch: if a problem hits real users but not the probes, the probes' successes hide it.
- Combine related services into one group for monitoring, ideally ones that share a failure domain.
- Change the service so one failure hurts less: client retries with exponential backoff and jitter, or fallback paths.
- Lower the SLO or lengthen the window, which is a product decision agreed with stakeholders.
Targets at the extremes need care too. At a 90% SLO, a 100% outage uses only 1.4% of the budget in an hour, so the 2%-in-an-hour page can never fire. At 99.999%, a full outage empties a month's budget in 26 seconds, faster than many monitoring pipelines can even notify. [1]
- In the data plan
- A tiny plan where one photo upload looks like a third of the month gone.
- In the system
- A service so quiet that one error looks like a huge burn rate.
10 / What stays
Which cause-based alerts should you keep?
Not all of them go. The SRE book's conclusion is to focus "primarily on symptoms for paging, reserving cause-oriented heuristics to serve as aids to debugging problems". It also favours a dashboard over email alerts for subcritical problems. [5]
Saturation is the classic case. The book's example of an imminent problem is "It looks
like your database will fill its hard drive in 4 hours", and it counts "nearly full"
parts of a service as imminent. [5] A prediction like that
can still page, because no SLO burns until the disk is full. Prometheus has
predict_linear(), which fits a straight line to a gauge.
[8] Here, disk_free_bytes stands in for your
exporter's free-space gauge:
- alert: DiskFullIn4Hours
  expr: predict_linear(disk_free_bytes[6h], 4 * 3600) < 0
  labels:
    severity: page
Sort each existing alert with the helper below.
Figure 2 · Page, ticket or dashboard?
Pick an alert your team gets today. The helper says where it belongs and why.
- In the data plan
- The per-app usage screen. Useful when you are already over budget and want to know which app did it.
- In the system
- CPU, memory and restart dashboards. You open them after the SLO alert, to find the cause.
11 / Making it stick
How do you roll it out and keep it honest?
Here is a rollout order that keeps the old safety net until the new one is proven.
- Write the SLO document. The Workbook lists what it holds: authors, reviewers and approvers, the approval date and next review date, the SLIs, how the budget is calculated, and the reasoning behind the numbers. [2]
- Write the error budget policy and get it signed by product, development and SRE. [2]
- Ship the recording rules and a dashboard first. Watch the SLI and budget for a few weeks.
- Run the burn-rate alerts as tickets alongside the old pages. This is a recommendation, not a Workbook rule: it lets you compare both sets against real incidents before anyone loses a page.
- Check the alerts against history. The Workbook suggests looking at known outages and support tickets, and checking they match steep drops in the budget. [2]
- Switch the burn-rate tiers to paging, then demote the old CPU and disk pages to dashboards or tickets one by one.
How to know it worked
- Your
promtoolunit tests pass in CI, including the "doesn't fire" case. - Past incidents line up with budget drops, and budget drops line up with incidents. The Workbook says misses either way mean the SLO or SLI needs work. [2]
- Pages per shift go down. The SRE book's team reviews page frequency, "usually expressed as incidents per shift", in quarterly reports with management. [5]
Common mistakes
- Tuning every service separately. The Workbook strongly advises against setting windows and burn rates per service. Decide once and apply them to all, grouping request types into a few buckets if needed. [1]
- Averaging ratios across instances instead of summing the counts first. [10]
- A latency threshold with no matching bucket, which silently returns nothing. [11]
-
Adding
for:to SLO alerts, which brings back the slow detection and resets of approach 3. [1] - An SLO without a policy, which the Workbook says becomes "simply another KPI" instead of a decision-making tool. [2]
What to watch, and how often to review
Watch the remaining budget on a dashboard, plus the burn rate for each window. Also
watch your rule evaluation. If a rule group takes longer than its interval, the next run
is skipped, the recorded series gets a gap, and
rule_group_iterations_missed_total goes up.
[6] A gap in a recorded SLI is a gap in your alerting.
Review the SLO often at first. The Workbook suggests "perhaps every month" when starting out, and quarterly or less once the SLO is established. It pairs a four-week window with weekly summaries and quarterly reports. [2]
- In the data plan
- Checking the bill every month at first, then every quarter once you trust the plan size.
- In the system
- Reviewing the SLO monthly at first, then quarterly, and checking pages per shift go down.
Keep these names
A small glossary
- SLI (service level indicator)
- A measure of service, best written as good events divided by all events.
- SLO (service level objective)
- The target for an SLI over a window, such as 99.9% over 30 days.
- SLA (service level agreement)
- A contract with consequences, often financial, if the SLOs are missed.
- Error budget
- 100% minus the SLO: the bad events you are allowed in the window.
- Error budget policy
- The written, agreed actions taken when the budget is spent.
- Burn rate
- How fast the budget is being spent, relative to spending it exactly over the window.
- Precision and recall
- The share of alerts that were significant, and the share of significant events that alerted.
- Detection and reset time
- How long until an alert fires, and how long it keeps firing after the fix.
- Recording rule
- A Prometheus rule that saves an expression's result as a new time series.
- Inhibition
- An Alertmanager rule that mutes one alert while another, related one is firing.
Check the concept
Can you explain it back?
1. Why is "CPU above 90%" a poor page?
It is a cause, not a symptom. It fires when users are fine and misses failures CPU can't see.
2. A 99.9% SLO over 30 days. What error rate is a burn rate of 14.4?
14.4 × 0.1% = 1.44%. At that rate the budget is gone in 720 ÷ 14.4 = 50 hours.
3. Why does each tier have a short window as well as a long one?
To check the budget is still being spent. After a fix, the short window drops below the line quickly, so the alert stops instead of firing for the rest of the long window.
4. Why not just add for: 1h to an error-rate alert?
A full outage would page after an hour, the same as a tiny one, having already spent more than the month's budget. And any dip below the line resets the timer.
5. A service gets 10 requests an hour. What goes wrong, and what can you do?
One failure is a 10% error rate and pages at once. Add synthetic traffic, group it with related services, make single failures less harmful, or agree a lower SLO.
Continue the thread
Where the signals come from, and where they go
- Kubernetes observability: collecting the metrics these SLIs are built from, without drowning in them.
- Canary releases with Argo Rollouts: using the same error and latency queries to stop a bad release before it spends the budget.
- SLOs and error budgets, the short explainer: a quicker visual walk through the budget idea.
Read further
Sources
All accessed 20 November 2026. Prometheus pages are the "latest" docs on that day.
- Google SRE Workbook, Chapter 5: Alerting on SLOs
- Google SRE Workbook, Chapter 2: Implementing SLOs
- Google SRE Workbook, Appendix: Example Error Budget Policy
- Site Reliability Engineering, Chapter 4: Service Level Objectives
- Site Reliability Engineering, Chapter 6: Monitoring Distributed Systems
- Prometheus docs: Defining recording rules
- Prometheus docs: Alerting rules
- Prometheus docs: Query functions
- Prometheus docs: Operators
- Prometheus docs: Recording rules (best practices)
- Prometheus docs: Histograms and summaries
- Prometheus docs: Unit testing for rules
- Prometheus docs: Alertmanager configuration
- Prometheus docs: Querying basics