Cloud & DevOps · Explainer
Canary releases that roll themselves backThink of opening a new bridge.
A release passed every test, then failed for one user in ten. Somebody had to spot it on a dashboard and roll it back by hand at 2 a.m. This is how to make the release do that job itself.
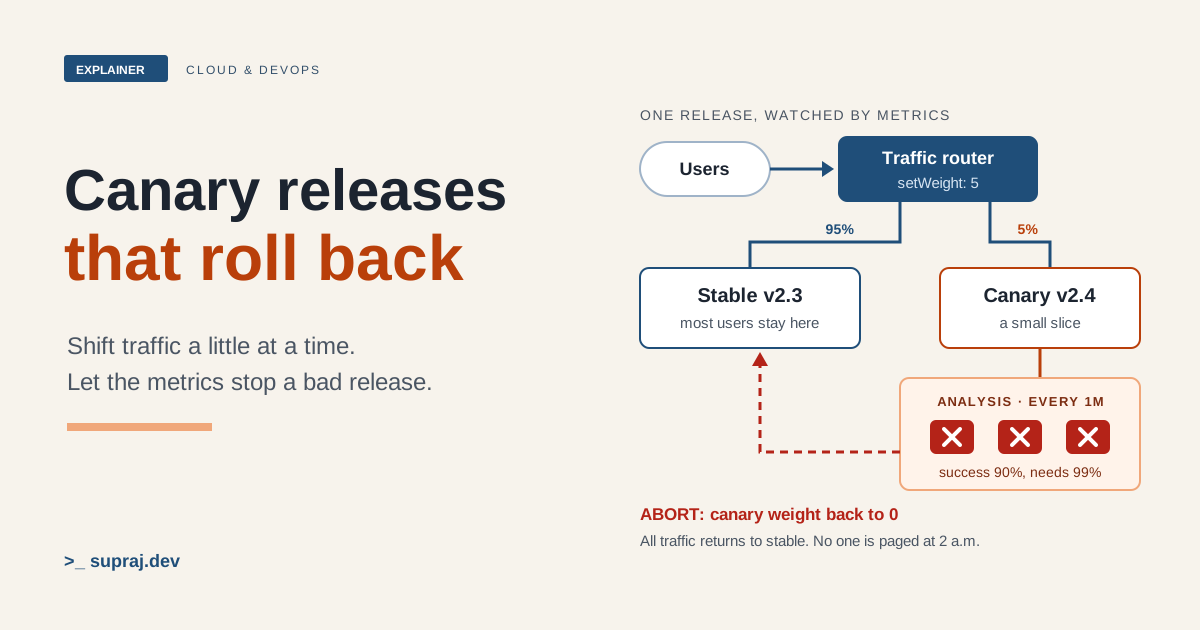
Here's the situation. A team ships version 2.4 of a checkout service. Unit tests pass. Integration tests pass. Readiness probes pass. But a change in one code path breaks checkout for about 10% of users, the ones on an older account type.
The pods are healthy, so the rolling update finishes in minutes. At 2 a.m. the on-call engineer spots a bump in the error graph, finds the release and rolls it back by hand.
The team wants releases that move traffic over a little at a time and go back on their own when the numbers look bad. That's progressive delivery, built here with Argo Rollouts and Prometheus.
One picture runs throughout. The old bridge carries all the cars today. You've built a new one beside it. How do you move the cars without sending all of them over a bridge that might have a crack in it?
01 / The problem
Why did a rolling update let a bad release through?
Because it only checks that new pods are up, not whether they serve users well. RollingUpdate is the default strategy of a Deployment. It "slowly replaces the old version with the new version", scaling the old one down as the new one comes up. [1] By default it keeps at least 75% of the desired pods up and at most 125% running. [15]
The Deployment controller does stop a rollout on its own when new pods never become ready, for example when an image can't be pulled. [15] Our bad release's pods start, pass their probes and become available, so the controller sees a good rollout.
Two pieces are missing:
- No traffic control. Argo's docs put it plainly: with core Kubernetes objects, "the only way to control traffic distribution between different versions of an application is by adjusting their replica counts". [6]
-
No automatic analysis. Even the progress deadline only reports. When
progressDeadlineSeconds(600 by default) runs out, "Kubernetes takes no action on a stalled Deployment other than to report a status condition". [15]
More tests won't close the gap. Google's SRE workbook says you won't find every release defect "until real traffic is hitting the service". [19]
- At the bridge
- Lanes are moved from the old bridge to the new one, one by one. The only check is that each new lane is open. Nobody counts the cars that never reach the far bank.
- In the cluster
- A rolling update swaps pods while readiness passes. It never looks at error rates or latency, so a release that is healthy but wrong goes all the way.
02 / Two strategies
What makes a canary different from blue-green?
A canary "exposes a subset of users to the new version" while the rest stay on the old one. Once the new version looks right, it gradually replaces the old. [1] The SRE workbook defines canarying as "a partial and time-limited deployment of a change in a service and its evaluation". The part with the change is the canary. The rest is the control. [19]
A blue-green deployment runs both versions, but "only the old version of the application will receive production traffic". You can test the new one, then switch the live traffic over. [1]
Argo Rollouts gives you both. A Rollout is "equivalent to a Kubernetes Deployment object", and adds traffic routing, metric analysis and "automated promotion or rollback based on successful or failed metrics". [1]
- At the bridge
- Canary: wave a few cars across and watch them. Blue-green: inspect the closed bridge, then swing the road sign for everyone.
- In the cluster
- Canary sends a share of real requests to the new ReplicaSet. Blue-green tests it privately, then moves the live Service in one switch.
03 / The building blocks
How do canary steps work in Argo Rollouts?
You list steps, and the controller walks through them whenever the pod template changes.
The two basic steps are setWeight, "the percentage of traffic that should be
sent to the canary", and pause. [2] A pause with
a duration waits that long. A pause with no duration waits until someone promotes the
rollout. [2]
This is the docs' own example, cut to the strategy:
strategy:
  canary:
    maxSurge: '25%'
    maxUnavailable: 0
    steps:
      - setWeight: 10
      - pause:
          duration: 1h # 1 hour
      - setWeight: 20
      - pause: {} # pause indefinitely
Durations take "s", "m" or "h", and a bare number means seconds.
[2] To move past an open-ended pause, run
kubectl argo rollouts promote <rollout>. Adding --full
skips the remaining analysis, pauses and steps. [9]
The first time you create a Rollout, it scales straight to 100% and skips the steps. [8] When every step has passed, the new ReplicaSet is marked "stable". If the rollout is aborted, by a person or by failed analysis, it falls back to that stable version. [8]
Moving from a Deployment means changing apiVersion to
argoproj.io/v1alpha1, kind to Rollout, and the
strategy. [21]
- At the bridge
- The traffic officer's plan: one car in ten for an hour, then two in ten, then wait for a signature.
- In the cluster
-
setWeightandpausesteps, run in order for every new pod template.
04 / Precision
How exact is the traffic split?
Replica weighting (no traffic router)
Without a router, the weight is approximated with pod counts behind one Service. With 10
replicas and setWeight: 10, the controller runs 1 new pod and 9 old ones. A
weight of 41% becomes 4 new pods out of 10, the closest whole number.
[2] So the smallest step is one pod. The getting-started
guide shows the cost: with 5 replicas, its rollout "could only achieve a minimum canary
weight of 20%". [8]
A traffic router (mesh, gateway or ingress)
With a router, Argo Rollouts edits the router's own resources to send the exact weight.
Supported routers include the AWS ALB controller, Gateway API (through a plugin), Istio,
Kong, NGINX Ingress, SMI and Traefik. [1] [6] You
name a canaryService and a stableService, and the controller
points each at the right ReplicaSet as the rollout moves. [6]
Now 5% means 5% of requests, whatever the pod count. For NGINX and plugins,
maxTrafficWeight changes the total from 100, for example to 1000, which
allows finer steps. [10]
With a router, the stable ReplicaSet stays fully scaled by default, so an abort can
shift traffic back "without delay", at the cost of up to double the pods. Since v1.1 you can set dynamicStableScale: true to
shrink stable as the canary grows. [2]
In November 2025 the Kubernetes project announced that Ingress NGINX would be retired, with best-effort maintenance only until March 2026 and no releases or security fixes after that. SIG Network recommends moving to Gateway API or another controller. [20] Don't build a new canary setup on it. This article's examples use Istio.
- At the bridge
- Without an officer, the share of cars follows how many lanes are open. An officer with a counter can wave exactly one car in twenty.
- In the cluster
- Replica weighting is as fine as one pod out of the total. A traffic router splits by request, so the weight no longer depends on pod count.
05 / The other option
When should you use blue-green instead?
When two versions can't safely share the work. Argo's docs are direct about it. Blue-green "always works because only one application is active at a time", while "not all applications can have different versions running in parallel". It also works with queue workers, because Argo Rollouts "doesn't control traffic flow for connections it doesn't understand". [1] The docs suggest starting with blue-green, then moving to canaries. [1]
A blue-green Rollout names a required activeService and an optional
previewService, and the controller puts the ReplicaSet's hash into their
selectors. The sequence: [3]
- The preview Service points at the new ReplicaSet. The active Service stays on the old one.
- When the new pods are fully available,
prePromotionAnalysisruns. If it fails, traffic never moves. - The rollout pauses if
autoPromotionEnabledis false (it defaults to true) orautoPromotionSecondsis set. - On promotion, the active Service switches to the new ReplicaSet and
postPromotionAnalysisstarts. If that fails or errors, traffic goes back to the previous stable ReplicaSet. - The old ReplicaSet is scaled down after
scaleDownDelaySeconds, 30 by default.
The delay gives nodes time to update their routing after the Service selector changes. [3] One warning from the docs: blue-green behind an AWS ALB ingress "is not supported without a chance of downtime". [3]
Figure 1 · Which strategy fits your service?
Answer both questions to see the strategy Argo's docs point to.
- At the bridge
- A second, complete bridge. Inspectors drive it, then the road sign swings. The old bridge stays up for a while in case you need it.
- In the cluster
-
Preview Service for tests, active Service moved on promotion, old ReplicaSet kept for
scaleDownDelaySeconds.
06 / The judge
How does the rollout decide to abort on its own?
It runs a check you've written down as an AnalysisTemplate. A template says which metrics to measure, how often, and which values count as success or failure. Each time a rollout uses it, the controller creates an AnalysisRun. A run ends Successful, Failed or Inconclusive, and that makes the rollout continue, abort or pause. [4]
The fields you'll use most:
interval: how often to measure. With no interval, an inline analysis takes one measurement and finishes. [4]count: how many measurements to take. [4]successConditionandfailureCondition: expressions overresult, usuallyresult[0]for a Prometheus vector. [5]-
failureLimit: how many failed measurements are tolerated. The default, 0, tolerates none. [4] The controller fails the metric once the failed count is greater than the limit, sofailureLimit: 2fails on the third bad reading. [14]
You attach analysis in one of two ways. Background analysis runs beside the steps. If it fails, the rollout aborts, sets the canary weight back to zero and is marked Degraded. [4] Inline analysis is a step of its own. It blocks the rollout until it finishes, then the rollout either goes on or aborts. [4] For the 2 a.m. problem you want background analysis, because it watches for as long as the canary takes traffic.
If a value meets neither condition, or there are no conditions at all, the run is Inconclusive, and the rollout pauses for a human. [4] If the metric source itself keeps failing, for example Prometheus is down, more than four errors in a row by default put the run in Error. [14] A background or step analysis in Error aborts the rollout, just like a failure. [14]
Figure 2 · Replay the 2 a.m. release, with analysis switched on
Version 2.4 is applied. Press Next step to start the canary.
interval: 1m and
failureLimit: 2, as in chapter 10. Real timings also depend on your scrape
interval and the rate window in the query.
- At the bridge
- An inspector at the far end counts arrivals every few minutes. Three bad counts and she closes the new bridge herself.
- In the cluster
-
An AnalysisRun queries Prometheus on each interval. When failed measurements exceed
failureLimit, the run fails and the Rollout aborts.
07 / What to measure
Which metrics and thresholds should you choose?
Start from your SLIs. The SRE workbook calls them "a place to start thinking about canary metrics", and picks HTTP return codes and latency as the best signals for a frontend service, because they map most closely to problems users feel. It warns that CPU usage can make a canary flaky or noisy, until operators ignore or disable it. [19] Keep the list short: "perhaps no more than a dozen". [19]
Measure the canary, not the whole service
This is what made the 2 a.m. incident hard to see. The workbook's example: a canary on 5% of the population with a 20% error rate shows up as only a 1% error rate across the service. [19] You must be able to break metrics down by canary and control.
Argo Rollouts gives you the key. Each ReplicaSet's pods carry a
rollouts-pod-template-hash label, which the controller writes into the
canary and stable Service selectors. [7] An analysis argument
can take that hash with podTemplateHashValue: Latest or
Stable. [4] To filter on it in PromQL, copy the
pod label onto your series at scrape time with a relabel rule (the default action is
replace). Kubernetes discovery exposes it as
__meta_kubernetes_pod_label_rollouts_pod_template_hash, because unsupported
characters become underscores. [18]
# In the scrape job for your app's pods (kubernetes_sd_configs, role: pod)
relabel_configs:
  - source_labels: [__meta_kubernetes_pod_label_rollouts_pod_template_hash]
    target_label: rollouts_pod_template_hash
Success rate, written so that silence fails
The queries below assume your app exports a counter http_requests_total
with a code label and a histogram http_request_duration_seconds,
scraped by a job called checkout. Rename them to match yours.
sum(rate(http_requests_total{job="checkout", rollouts_pod_template_hash="{{args.canary-hash}}", code!~"5.."}[2m]))
/
sum(rate(http_requests_total{job="checkout", rollouts_pod_template_hash="{{args.canary-hash}}"}[2m]))
Why count successes? If the canary has served no 5xx yet, that series may not exist, and
in PromQL series with "no matching entry in the opposite vector" are dropped, so an error
ratio comes back empty.
[17] Argo's own examples count non-5xx responses for this
kind of query. [4] Pair it with
len(result) > 0 && result[0] >= 0.99, the guard Argo documents
for empty results. [4] Then no data fails the check.
Latency
histogram_quantile(0.99, sum by (le) (rate(http_request_duration_seconds_bucket{job="checkout", rollouts_pod_template_hash="{{args.canary-hash}}"}[2m])))
This is the pattern from Prometheus's docs: take rate() first, sum with
le kept in the by clause, then take the quantile.
[16] With no observations, the function returns NaN.
[16] A plain comparison like result[0] <= 0.5
on NaN is marked Failed, as Argo's docs show for result >= 0.95.
[4]
Thresholds: absolute and relative
Use two kinds. An absolute limit comes from your SLO: if checkout promises 99.9% success, a canary below 99% is far outside it. A relative limit compares canary with stable over the same minutes, so a bad hour for a shared database doesn't fail the canary. The workbook warns that before-and-after comparisons are risky, because "time is one of the biggest sources of change in observed metrics". It also says to keep absolute measures, because the canary and control can move together. [19]
The numbers here (99%, half a second, half a percentage point) are examples. Set yours from your SLO and past releases. [19]
For a stricter comparison, an Experiment step can run a fresh baseline and canary pair with their own pod hashes. [12]
- At the bridge
- The inspector counts cars on the new bridge only, and compares them with the old bridge in the same minutes. A storm that slows both isn't the new bridge's fault.
- In the cluster
- Filter by the canary's pod hash. Check it against an SLO-based limit and against the stable hash over the same window.
08 / The limits
What does an abort undo, and what does it leave behind?
An abort "stops progressing the current rollout and reverts all steps". [9] The stable ReplicaSet scales up, other versions scale down, and the canary weight goes back to zero. [8] [4] Routes Argo added for headers or mirroring are removed. [6]
| Undone | Not undone |
|---|---|
| Traffic weight to the canary |
The desired state. spec.template still holds the new version, so the
Rollout shows Degraded until you change it back. [9]
[8] In GitOps, that means a revert commit.
|
Canary pods (after abortScaleDownDelaySeconds, 30 by default with a router) [10] |
Database changes. A migration the new version ran stays applied. Nothing in the abort path touches your database. |
| Argo-managed header and mirror routes | Side effects. Emails sent, payments taken, messages published and rows written by the canary stay done. |
To make an abort safe, the old version has to work with whatever the new one wrote. The practical rule: ship schema changes that both versions can live with, in a release of their own, before the code that needs them. Remove the old columns only after the new code is stable.
Re-applying the stable manifest after an abort is fast: Argo treats it as a rollback and
skips analysis and steps. [8] Since v1.4,
rollbackWindow extends that to recent revisions.
[11]
- At the bridge
- Closing the new bridge sends cars back. It doesn't un-deliver parcels that crossed, or repaint the shared road you re-marked.
- In the cluster
- Abort restores pods and traffic. Data, external calls and the spec in Git are yours to handle.
09 / A second switch
Where do feature flags fit?
A canary tests a whole binary. A feature flag switches one behaviour inside it. The SRE workbook says flags "allow you to separate feature launches from binary releases", so you can "selectively disable" a misbehaving feature until the next release. [19]
They cover each other's gaps. The canary catches crashes and slow paths that no flag controls. The flag keeps a good binary when one feature is wrong. A flag around the new account-type code would have let our team switch it off without redeploying.
- At the bridge
- A barrier on one lane of the new bridge. You can lower it without closing the whole bridge.
- In the cluster
- The canary decides whether the new build stays. The flag decides whether one feature in it is on.
10 / Hands-on
What's the playbook, step by step?
This sets up checkout with Istio host-level splitting. Every Argo and Istio field comes from Argo's docs; swap in your own names and numbers.
Step 1. Install the controller and the kubectl plugin. [22]
kubectl create namespace argo-rollouts
kubectl apply -n argo-rollouts -f https://github.com/argoproj/argo-rollouts/releases/latest/download/install.yaml
brew install argoproj/tap/kubectl-argo-rollouts
Step 2. Create two Services and a VirtualService. Both Services select
app: checkout. The controller adds the pod hash to each selector. Istio
needs the weights to add up to 100, so start at 100 and 0. [7]
apiVersion: networking.istio.io/v1alpha3
kind: VirtualService
metadata:
  name: checkout-vsvc
spec:
  gateways:
  - checkout-gateway
  hosts:
  - checkout.example.com
  http:
  - name: primary
    route:
    - destination:
        host: checkout-stable
      weight: 100
    - destination:
        host: checkout-canary
      weight: 0
Step 3. Write the AnalysisTemplate.
apiVersion: argoproj.io/v1alpha1
kind: AnalysisTemplate
metadata:
  name: checkout-health
spec:
  args:
  - name: canary-hash
  - name: stable-hash
  metrics:
  - name: canary-success-rate
    interval: 1m
    initialDelay: 2m
    failureLimit: 2
    successCondition: len(result) > 0 && result[0] >= 0.99
    provider:
      prometheus:
        address: http://prometheus.monitoring.svc:9090
        query: |
          sum(rate(http_requests_total{job="checkout", rollouts_pod_template_hash="{{args.canary-hash}}", code!~"5.."}[2m]))
          /
          sum(rate(http_requests_total{job="checkout", rollouts_pod_template_hash="{{args.canary-hash}}"}[2m]))
  - name: canary-p99-latency
    interval: 1m
    initialDelay: 2m
    failureLimit: 2
    successCondition: len(result) > 0 && result[0] <= 0.5
    provider:
      prometheus:
        address: http://prometheus.monitoring.svc:9090
        query: |
          histogram_quantile(0.99, sum by (le) (rate(http_request_duration_seconds_bucket{job="checkout", rollouts_pod_template_hash="{{args.canary-hash}}"}[2m])))
  - name: canary-vs-stable
    interval: 1m
    initialDelay: 2m
    failureLimit: 2
    successCondition: len(result) > 0 && result[0] <= 0.005
    provider:
      prometheus:
        address: http://prometheus.monitoring.svc:9090
        query: |
          (
            sum(rate(http_requests_total{job="checkout", rollouts_pod_template_hash="{{args.stable-hash}}", code!~"5.."}[2m]))
            / sum(rate(http_requests_total{job="checkout", rollouts_pod_template_hash="{{args.stable-hash}}"}[2m]))
          ) - (
            sum(rate(http_requests_total{job="checkout", rollouts_pod_template_hash="{{args.canary-hash}}", code!~"5.."}[2m]))
            / sum(rate(http_requests_total{job="checkout", rollouts_pod_template_hash="{{args.canary-hash}}"}[2m]))
          )
initialDelay holds each metric back for two minutes, so the canary has
served some requests before it's judged. [4] The last metric
is stable success minus canary success. Each side is a
sum() with no labels left, so the two match one to one.
[17] With no count, background metrics keep
measuring until the rollout ends. [4]
Step 4. Convert the Deployment to a Rollout with background analysis.
apiVersion: argoproj.io/v1alpha1
kind: Rollout
metadata:
  name: checkout
spec:
  replicas: 10
  selector:
    matchLabels:
      app: checkout
  template:
    metadata:
      labels:
        app: checkout
    spec:
      containers:
      - name: checkout
        image: registry.example.com/checkout:2.3.0
        ports:
        - name: http
          containerPort: 8080
  strategy:
    canary:
      canaryService: checkout-canary
      stableService: checkout-stable
      trafficRouting:
        istio:
          virtualService:
            name: checkout-vsvc
            routes:
            - primary
      analysis:
        templates:
        - templateName: checkout-health
        args:
        - name: canary-hash
          valueFrom:
            podTemplateHashValue: Latest
        - name: stable-hash
          valueFrom:
            podTemplateHashValue: Stable
      steps:
      - setWeight: 5
      - pause: {duration: 10m}
      - setWeight: 25
      - pause: {duration: 10m}
      - setWeight: 50
      - pause: {duration: 10m}
Step 5. Try the analysis in dry-run first. Since v1.2, a metric listed
under dryRun is measured and reported but can't change the rollout's result.
metricName: .* covers every metric. [4] Run a
week of releases this way, then remove it.
Step 6. Release and watch. [8]
kubectl argo rollouts set image checkout checkout=registry.example.com/checkout:2.4.0
kubectl argo rollouts get rollout checkout --watch
Step 7. Prove it aborts. In staging, release a build that returns 500
for some requests. Check that the AnalysisRun fails, the weight drops to 0 and the
Rollout shows Degraded, then put the old image back. [8] If you need to
go again after fixing the cause, kubectl argo rollouts retry rollout checkout
retries an aborted rollout. [9]
- Use canary with a traffic router for stateless request services. Use blue-green for queue workers and anything holding a shared lock.
- Start at 5% with background analysis on success rate, p99 latency and canary-versus-stable. Keep the list that short.
- Run the analysis in dry-run for a week, then switch it on and prove one abort in staging.
- Make every schema change backward compatible and ship it on its own.
Figure 3 · The playbook at a glance
- Install the controller and plugin
- Two Services and a VirtualService at 100 / 0
- Relabel the pod hash onto your metrics
- AnalysisTemplate: success, latency, versus stable
- Rollout with steps and background analysis
- Dry-run the analysis for a week
- Prove one abort in staging
- 1. Install the controller into its own namespace, and the kubectl plugin on your machine.
- 2. The stable and canary Services both select the app. Argo adds the pod hash. The VirtualService starts all traffic on stable.
- 3. Copy the rollouts-pod-template-hash pod label onto your series, or you can't tell canary pods from stable ones.
- 4. Write the success-rate, latency and canary-versus-stable checks, each written so that no data fails.
- 5. Change the Deployment to a Rollout, add the steps, and attach the template as background analysis with both pod hashes.
- 6. Mark every metric as dry-run and compare its verdicts with what really happened.
- 7. Release a deliberately broken build in staging. Watch it fail, drop to 0% and go Degraded.
- Seven steps from a plain Deployment to a release that stops itself. Press Step through it to see each one.
11 / In production
What goes wrong in production, and what should you watch?
Common mistakes
- A metric window longer than the canary. An errors-per-hour metric can wrongly fail a 30-minute canary. Keep metric intervals "the same as or less than your canary duration". [19]
- Too little traffic. A canary needs enough requests to be representative, and performance defects typically show only under heavy load. [19]
- Counting 4xx as failures. A 404 can come from users with a broken link. The workbook suggests leaving 4xx out and using black-box probes for missing pages. [19]
- Several canaries at once. The workbook "strongly" advises one canary at a time, because overlapping canaries muddy the signal. [19]
-
Expecting
maxSurgeto limit pods with a router. With traffic routing,maxSurgeandmaxUnavailabledon't set the stable and canary replica counts. Stable stays at full scale, and withsetCanaryScalethe total can even pass twicespec.replicas. [2] Plan cluster capacity, or usedynamicStableScale. - Forgetting the Git revert. After an auto-abort, the spec still names the bad image. If the Rollout leaves the aborted state, it tries the new version again. [9]
- Pods outside the mesh. With Istio, only in-mesh traffic follows the rollout. [7]
What to monitor
The controller serves Prometheus metrics on port 8090 at /metrics. They
include rollout_info, analysis_run_info,
analysis_run_metric_phase and analysis_run_phase, plus
workqueue metrics for the controller's own health. [13]
- Degraded rollouts, so an auto-abort gets a human look in working hours.
- AnalysisRuns in Error. They usually mean a broken query or Prometheus, not a bad release.
- Inconclusive runs and paused rollouts, which are waiting on a person.
- Your usual SLO alerts. A passing canary doesn't prove the full release is fine.
- Aborts and false aborts over time. Tune thresholds from that record.
Keep these names
A small glossary
- Progressive delivery
- Releasing gradually, with metric analysis deciding whether to promote or roll back.
- Rollout
- Argo's replacement for a Deployment, with canary and blue-green strategies.
- Canary
- A small, time-limited slice of production running the new version, compared with the rest.
- Blue-green
- Two full versions, with live traffic on one until a single switch moves it.
- Stable ReplicaSet
- The last version that passed every step. Aborts fall back to it.
- Traffic router
- A mesh, gateway or ingress that splits requests by weight, header or mirror.
- AnalysisTemplate and AnalysisRun
- The written check, and one run of it during a rollout.
- failureLimit
- How many failed measurements a metric tolerates. The default 0 tolerates none.
- Abort
- Stop the rollout, send traffic back to stable and scale the canary down.
- Pod template hash
- The
rollouts-pod-template-hashlabel that tells canary pods from stable ones.
Check the concept
Can you explain it back?
1. Why didn't the rolling update stop the bad release?
Its pods were ready and available. A Deployment checks readiness, not error rates, and has no way to hold traffic at a small share.
2. You have 4 replicas and no traffic router. What's the smallest canary weight?
One pod out of four, so 25%. A traffic router would let you send 5% of requests whatever the pod count.
3. Why measure success rate instead of error rate in the query?
A healthy canary may have no 5xx series at all, which makes an error ratio empty.
Counting non-5xx responses, with a len(result) > 0 guard, makes no data
fail.
4. With failureLimit: 2, which bad measurement aborts the rollout?
The third. A metric fails when its failed count is greater than the limit.
5. The canary ran a migration that dropped a column, then aborted. Is the column back?
No. An abort only moves traffic and pods. That's why schema changes should work with both versions and ship separately.
6. Your service reads jobs from a queue. Canary or blue-green?
Blue-green. Argo can't split queue traffic, and its docs list blue-green as the option that works with queue workers.
Continue the thread
Before and after the release
- CI/CD for absolute beginners. How code gets from a commit to production, and why dev, staging and production exist.
- Kubernetes observability in 2026. Building the metrics stack your canary analysis depends on, and keeping cardinality under control.
Read further
Sources
All accessed 20 November 2026. Argo Rollouts docs are the "stable" pages served that day. Argo Rollouts source is pinned to the v1.10.2 tag, the latest GitHub release that day.
- Argo Rollouts docs: Concepts
- Argo Rollouts docs: Canary deployment strategy
- Argo Rollouts docs: BlueGreen deployment strategy
- Argo Rollouts docs: Analysis and progressive delivery
- Argo Rollouts docs: Prometheus metrics provider
- Argo Rollouts docs: Traffic management
- Argo Rollouts docs: Istio traffic routing
- Argo Rollouts docs: Getting started
- Argo Rollouts docs: kubectl argo rollouts abort, with the promote and retry rollout pages
- Argo Rollouts docs: Rollout specification
- Argo Rollouts docs: Rollback windows
- Argo Rollouts docs: Experiment CRD
- Argo Rollouts docs: Controller metrics
- Argo Rollouts source v1.10.2: analysis/analysis.go, with utils/defaults/defaults.go and rollout/analysis.go
- Kubernetes docs: Deployments
- Prometheus docs: Query functions (rate, histogram_quantile)
- Prometheus docs: Operators (vector matching)
- Prometheus docs: Configuration (Kubernetes discovery, relabeling)
- Google SRE Workbook, Chapter 16: Canarying Releases
- Kubernetes blog: "Ingress NGINX Retirement: What You Need to Know" (11 November 2025)
- Argo Rollouts docs: Migrating to Rollouts
- Argo Rollouts docs: Installation
Written with AI assistance. Every technical claim was checked against the original sources listed above.