Explainer · Kubernetes and FinOps
Your Kubernetes bill doubled.Finding and cutting the waste.
Traffic grew a little. The bill grew a lot. The cause is usually not the cloud's prices. It's that Kubernetes fills nodes by what pods reserve, and nobody has checked the reservations in a year.
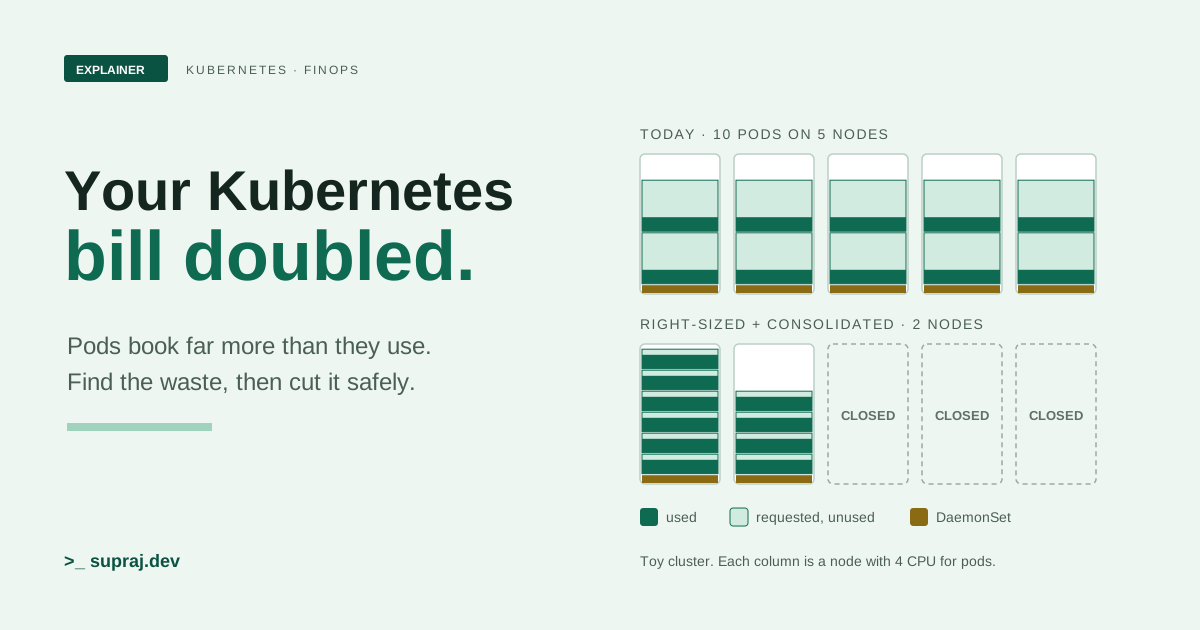
A platform team gets a message from finance. The Kubernetes bill has doubled in six months. Traffic is up a little. Finance wants to know why, and wants a plan.
This is a common shape of problem, and it has a common cause. To make it easy to hold in your head, picture the cluster as a rented office building. Each node is a floor you pay rent on. Each team books desks for its people. A building manager assigns people to floors based on the bookings. When a floor is fully booked, the manager opens a new one, and the rent goes up. Nobody checks whether the booked desks have anyone sitting at them.
01 / The situation
Why did the bill double when traffic barely moved?
Because the bill follows nodes, and nodes follow requests. A cloud bills you for each node for as long as it runs. The OpenCost specification, an open standard for measuring Kubernetes cost, calls these "Resource Allocation Costs": expenses that accumulate "based on the amount of time provisioned irrespective of usage". [20] An idle CPU on a running node costs the same as a busy one.
What decides how many nodes you run? In most clusters, an autoscaler adds a node when pods can't be placed, and removes one when it isn't needed. Placement depends on each pod's request: the CPU and memory it says it needs. So if requests grow, the node count grows, even when real usage stays flat.
Requests grow quietly. A team copies a manifest with generous numbers. Someone doubles the memory after one out-of-memory crash and never lowers it. A load test finishes, but its namespace stays. Each change is small and sensible on its own. Over six months they add up to a bill that has drifted away from traffic.
- In the office
- Rent is per open floor. A floor full of booked but empty desks costs the same as a floor full of people.
- In the cluster
- You pay for each node while it runs. Pod requests decide how many nodes the cluster needs, whatever the pods actually use.
02 / The mechanism
How does the scheduler decide a node is full?
It adds up requests. It never looks at live usage when it places a pod. The Kubernetes docs say the scheduler "ensures that, for each resource type, the sum of the resource requests of the scheduled containers is less than the capacity of the node". And then, the important part: "although actual memory or CPU resource usage on nodes is very low, the scheduler still refuses to place a Pod on a node if the capacity check fails". [1]
That's deliberate. It protects the node when usage later rises, for example "during a daily peak in request rate". [1] A request is a promise. The scheduler keeps promises, so it books by promises.
The capacity it books against isn't the whole machine either. Each node has an
allocatable amount, "the amount of compute resources that are available
for pods", after reserving some for system daemons. The scheduler "does not
over-subscribe 'Allocatable'". [3] You can see it with
kubectl describe node, which lists capacity, allocatable, each pod's
requests and the total under "Allocated resources". [1]
Node autoscalers use the same numbers. Karpenter's docs say "Instance type selection math only uses requests", and when it sizes a node it adds "the resource requests of every DaemonSet that would run on that node" to the pods' own requests. [30]
Requests and limits do different jobs, and it helps to keep them apart:
- Requests drive placement. A container may use more than its request if the node has spare room. [1] The CPU request also acts as a weight when containers compete for CPU. [1]
- CPU limits are enforced by throttling. The kernel restricts the container, but doesn't kill it for using too much CPU. [1]
- Memory limits are enforced by out-of-memory kills. If a container uses more than its limit, "the kernel may terminate it". [1]
- In the office
- The manager seats people by booked desks, not by who turned up today. A floor with every desk booked counts as full, even if it's quiet.
- In the cluster
- kube-scheduler and Karpenter both use requests. A node whose requests reach its allocatable takes no more pods, however idle it is.
03 / The audit
Where does the waste actually hide?
In five places, roughly in order of how much they usually matter.
- Requests far above usage. This is the big one. Every spare core you request is a core you rent.
- Nodes the scheduler can't pack. If each pod asks for 1.5 CPU and a node has 1 CPU left, that CPU is stranded. The Kubernetes docs walk through this on a real node: once enough is requested, a pod asking for more than what's left "will not fit on the node". [1] Scheduling rules make it worse. Karpenter warns that preferred anti-affinity and topology spreads "can reduce the effectiveness of consolidation". [28]
- Idle and forgotten namespaces. Load-test, preview and demo namespaces keep their pods, and their requests, until someone deletes them.
- Over-provisioned system pods. A DaemonSet "ensures that all (or some) Nodes run a copy of a Pod". [4] So a logging or monitoring agent's request is paid once per node. Generous requests on those agents shrink every node's room for your apps.
-
Unused volumes and load balancers. Storage and load balancers sit
outside the node bill and are easy to forget. A PersistentVolume with the
Retainpolicy outlives its claim; the docs say the storage asset "still exists" even after the PV object is deleted, until you delete it by hand. [5] Dynamically provisioned volumes inherit their StorageClass's reclaim policy, "which defaults toDelete". [5] A Service oftype: LoadBalancer"provisions a load balancer" on clouds that support it. [6]
Here's the first and second kind of waste on a toy cluster, and why fixing requests on its own doesn't change the bill.
Figure 1 · Ten pods, five floors, three moves
- Open floors (the bill)
- 5 of 5
- CPU booked
- 16.25 of 20 CPU (81%)
- CPU actually used
- 5.25 of 20 CPU (26%)
- CPU the pod uses
- CPU the pod requests but doesn't use
- DaemonSet on every open floor
Today. Each pod requests 1.5 CPU but uses 0.4. Two pods fill a floor on paper (3 of the 3.75 CPU left after the daemon), so ten pods need five floors, and every floor is mostly empty desks.
Notice stage 2. Cutting requests alone saves nothing. The pods stay where they are, and all five nodes keep running. The money only comes back when something moves the pods together and removes the empty nodes. That's why a cost plan needs both right-sizing and consolidation.
- In the office
- Teams book desks they don't use, every floor has its own cleaning crew, and a few locked storerooms belong to teams that left.
- In the cluster
- Inflated requests, DaemonSets on every node, forgotten namespaces, and volumes and load balancers nobody uses.
04 / The numbers
How do you measure requests against real usage?
Start with a quick look, then build the real picture in Prometheus, then put money on it.
The quick look
If metrics-server is installed, kubectl top shows live usage. Its reference
documents -A for all namespaces, --sort-by for
cpu or memory, and --containers to split a pod
by container. [15]
kubectl top pod -A --sort-by=cpu
kubectl top pod POD_NAME -n NAMESPACE --containers
kubectl describe node NODE_NAME   # see "Allocated resources"
This is a snapshot, not a history. metrics-server itself says it "is meant only for autoscaling purposes" and shouldn't be the source for a monitoring system. [18] For decisions, you need weeks of data.
Requests against usage in Prometheus
Two metric families give you both sides. kube-state-metrics publishes
kube_pod_container_resource_requests, with a resource label
for cpu or memory. [16] The
kubelet's /metrics/resource endpoint publishes
container_cpu_usage_seconds_total and
container_memory_working_set_bytes, labelled by container, pod and
namespace. [14] CPU usage is a counter, so take its
rate(), the "per-second average rate of increase".
[19]
# CPU cores requested, per namespace
sum by (namespace) (kube_pod_container_resource_requests{resource="cpu"})

# CPU cores used, per namespace (5-minute average)
sum by (namespace) (rate(container_cpu_usage_seconds_total[5m]))

# Memory requested and memory in use (working set), per namespace
sum by (namespace) (kube_pod_container_resource_requests{resource="memory"})
sum by (namespace) (container_memory_working_set_bytes)
Two cautions. cAdvisor exposes metrics with the same names, so if you scrape both
sources, filter to one by its scrape job or you'll count usage twice.
[17] And kube-state-metrics itself recommends the
scheduler's kube_pod_resource_request metric as "more precise" for
requests. [16] The Kubernetes metrics reference lists it
as stable, from kube-scheduler. [14]
Compare requests with a high percentile or peak of usage over at least a couple of weeks, not the average. A workload with a Monday peak will look wasteful on a Sunday.
Putting money on it with OpenCost
Finance doesn't want cores. It wants cost per team. OpenCost's specification charges a workload max(request, usage) for resources like CPU, because that's what was "directly reserved or allocated by kube-scheduler". [20] It also defines two kinds of idle cost. Cluster idle is allocation cost "not allocated to any workload", which is empty node space. Workload idle is "requested resources that are unused", which is over-requesting. [20] Those two numbers map straight onto the two fixes: consolidation and right-sizing.
The OpenCost API runs on port 9003. Its docs show the port-forward and a query for the last seven days by namespace. [21] [22]
kubectl -n opencost port-forward deployment/opencost 9003

curl -G http://localhost:9003/allocation \
  -d window=7d \
  -d aggregate=namespace \
  -d resolution=1m
The aggregate parameter also accepts label:LABEL_NAME, and
comma-separated lists such as aggregate=namespace,label:app. Other
parameters include includeIdle and shareIdle.
[21] If every workload carries a team label, one query
gives finance its table. The allocation API describes its costs as "based on on-demand
list pricing", so expect them to differ from an invoice with discounts applied.
[21]
- In the office
- Walk the floors with a clipboard: desks booked per team, desks occupied, and the rent split by team.
- In the cluster
- Requests from kube-state-metrics, usage from the kubelet, and cost per namespace or label from OpenCost.
05 / Right-sizing
How do you right-size requests without breaking things?
You could read the dashboards and edit every manifest by hand. For a few big workloads, that's fine. For hundreds, use the Vertical Pod Autoscaler (VPA). Its README says it sets requests "automatically based on usage", and can both shrink pods that over-request and grow pods that under-request. [23]
Recommend first, act later
VPA has several modes. In the current quick start: [24]
| Mode | What it does |
|---|---|
Off |
Calculates recommendations you can inspect. Changes nothing. |
Initial |
Sets requests only when a pod is created. Never changes them later. |
Recreate |
The default. Also updates running pods by evicting them when requests differ significantly, respecting PodDisruptionBudgets. |
InPlaceOrRecreate |
Tries an in-place resize first, and falls back to evicting the pod. |
InPlace |
In-place resize only. Never evicts; retries later if a resize can't happen. |
Auto |
Deprecated. Currently the same as Recreate. |
Start every workload in Off. Then kubectl describe vpa shows
the recommendation. [24] It has a target,
a lowerBound and an upperBound. The API reference says running
below the lower bound "is likely to have significant impact on performance/availability",
and anything allocated above the upper bound is "likely wasted".
[27] That gives you a safe range to set requests in.
apiVersion: autoscaling.k8s.io/v1
kind: VerticalPodAutoscaler
metadata:
  name: checkout-vpa
spec:
  targetRef:
    apiVersion: "apps/v1"
    kind: Deployment
    name: checkout
  updatePolicy:
    updateMode: "Off"
  resourcePolicy:
    containerPolicies:
      - containerName: '*'
        minAllowed:
          cpu: 100m
          memory: 128Mi
        maxAllowed:
          cpu: "2"
          memory: 2Gi
The minAllowed and maxAllowed fields bound the recommendation,
as in the quick start's own example. [24] By default VPA
controls requests and limits, scaling the limit "proportionally to the request";
controlledValues: RequestsOnly leaves limits alone.
[27]
The caveats that bite
- Not with HPA on the same metric. VPA "should not be used with" a Horizontal Pod Autoscaler on CPU or memory. It can share a workload with an HPA on a different or custom metric. [26]
-
Recommendations can outgrow your nodes. A recommendation may exceed
node size or quota "and cause pods to go pending". [26]
Set
maxAllowed. - Evictions aren't guaranteed to land. VPA can't guarantee that pods it evicts "will be successfully recreated". [26]
-
Only controller-managed pods are updated, and VPA is "not compatible"
with workloads that set pod-level
resources. [26] [23] - It doesn't edit your manifests. The quick start notes that VPA "does not modify the template in the deployment"; it changes the running pods. [24] If your GitOps tool owns requests, copy the recommendation into Git instead.
In-place resize
Kubernetes can now change a running container's CPU and memory without recreating the
pod. The InPlacePodVerticalScaling feature gate was beta and on by default
in 1.33 and 1.34, and is stable from 1.35. [10] You resize
through the pod's resize subresource, which needs kubectl v1.32 or later.
[9]
kubectl patch pod POD_NAME -n NAMESPACE --subresource resize --patch \
  '{"spec":{"containers":[{"name":"app", "resources":{"requests":{"cpu":"800m"}, "limits":{"cpu":"800m"}}}]}}'
The docs list real limits. A resize can't change the pod's QoS class. Lowering a memory
limit is "best-effort" with no guarantee against OOM kills. And a container's
resizePolicy can require a restart, which the docs say is "often necessary
for memory changes". [9] VPA's in-place modes inherit these:
its docs say in-place updates "cannot guarantee zero disruption", and
InPlace mode is alpha in VPA 1.7.0. [25]
- In the office
- Before shrinking any team's booking, watch how many desks it really uses for a few weeks, and never book below its busiest day.
- In the cluster
-
Run VPA in
Offmode, read the target and bounds, and apply them through your normal deploy path before letting VPA act on its own.
06 / Consolidation
How do you close the half-empty floors?
After right-sizing, your nodes have room, but you still pay for all of them. Something has to move pods together and remove nodes. On clusters that use Karpenter, that's consolidation. Its docs describe three outcomes: remove an empty node, remove a node whose pods "will run on other nodes in the cluster", or replace a node "with lower priced variants". [28]
Two NodePool fields control it. consolidationPolicy picks which nodes are
candidates. The current docs (v1.15) list three: [28]
-
WhenEmpty: only empty nodes, meaning nodes running nothing but pods with no disruption cost, such as DaemonSet pods. The most conservative. -
Balanced: nodes "where the cost savings outweigh the disruption to running pods". It skips marginal moves. -
WhenEmptyOrUnderutilized: any node that can be removed or replaced to reduce cost. This is the default if you set nothing.
consolidateAfter sets how long a node must stay unchanged before it's a
candidate; the timer resets whenever a pod lands or leaves, and Never
disables consolidation. The default is 0s.
[28]
Budgets keep it from moving too fast
Disruption budgets cap how many nodes Karpenter disrupts at once. If you
set none, it uses one budget of nodes: 10%. These are separate from
PodDisruptionBudgets, which limit how many pods of one application voluntary
disruptions take down at once. [13] Budgets can be scoped to reasons
(Empty, Underutilized, Drifted,
Unhealthy) and to a schedule, which is always in UTC. When several apply,
the strictest wins. [28] This NodePool fragment,
following the docs' examples, consolidates steadily but never during weekday business
hours: [28] [29]
apiVersion: karpenter.sh/v1
kind: NodePool
metadata:
  name: default
spec:
  disruption:
    consolidationPolicy: WhenEmptyOrUnderutilized
    consolidateAfter: 5m
    budgets:
    - nodes: "10%"
    - nodes: "0"
      schedule: "0 9 * * mon-fri"
      duration: 8h
      reasons:
      - "Underutilized"
What blocks it
Karpenter respects PodDisruptionBudgets, and "a single blocking PDB can prevent the
entire node from being voluntary disrupted". The
karpenter.sh/do-not-disrupt annotation on a pod also keeps its node out of
consolidation. [28] Preferred anti-affinity and topology
spreads can hold nodes too, as chapter 3 noted. When a node won't go, look at its
events: Karpenter reports Unconsolidatable with a reason, such as a PDB
that "prevents pod evictions". [28]
A PDB with maxUnavailable: 0 is safe for availability and fatal for
consolidation. For most stateless services, a PDB that allows one pod down at a time
gives both.
- In the office
- Each weekend, move people from half-empty floors onto other floors and hand back the keys. Never more than a few floors at once, and never during working hours.
- In the cluster
-
Consolidation drains and removes or replaces nodes, paced by disruption budgets and
held back by PDBs and
do-not-disrupt.
07 / Cheaper floors
Is spot capacity worth the risk?
Spot capacity is the cloud's spare machines, sold cheaply on the condition that it can take them back. AWS describes "steep discounts in exchange for returning them when Amazon EC2 needs the capacity back". [32] Google says Compute Engine "might preempt Spot VMs at any time". [33] The catch is the notice period.
- AWS issues a Spot interruption notice "two minutes before Amazon EC2 stops or terminates your Spot Instance". [31]
- GKE gives pods on Spot VMs a 30-second graceful period by default: 15 seconds for your pods, then 15 for critical system pods. It can be extended to 120 seconds. [34]
- On GKE, Spot reclamation "is involuntary and is not covered by the guarantees of PodDisruptionBudgets". [34]
Karpenter can react to the AWS notice. With an interruption queue configured through
--interruption-queue, it taints, drains and terminates the node ahead of
time, and starts a replacement "as soon as it sees the Spot interruption warning".
[28] If a NodePool allows several capacity types, Karpenter
prefers reserved, then spot, then on-demand, and falls back to on-demand when no spot is
available. [29]
So spot fits work that can lose a pod with little warning: stateless services with several replicas, batch jobs that retry, CI runners. It's a poor fit for single-replica services, long jobs that can't checkpoint, and stateful pods; GKE advises testing that stateful workloads "can gracefully terminate within 25 seconds". [34]
One Karpenter detail matters for cost. Spot-to-spot replacement consolidation is off
unless you enable the SpotToSpotConsolidation feature, and a single-node
spot replacement needs a choice of at least 15 instance types, so it doesn't race down
to the cheapest type with the highest interruption rate. [28] Give spot
NodePools a wide list of instance types.
- In the office
- Some floors rent at a big discount, but the landlord can reclaim them with a short notice. Put the teams who can pack up fast there.
- In the cluster
- Spot nodes for replicated, restartable work, on-demand as the fallback, and interruption handling turned on.
08 / Keeping it fixed
How do you stop the waste coming back?
With two built-in guardrails, set per namespace.
A LimitRange sets defaults and bounds for each container. It can
"set default request/limit" for containers that don't declare any, and enforce minimum,
maximum and request-to-limit ratios. [7] That catches pods
that set nothing at all. Such a pod is BestEffort: it can use any node
resources not assigned to others, and the kubelet "prefers to evict" it under pressure.
[11] The Kubernetes docs show this shape: [7]
apiVersion: v1
kind: LimitRange
metadata:
  name: mem-limit-range
spec:
  limits:
  - default:
      memory: 512Mi
    defaultRequest:
      memory: 256Mi
    type: Container
A ResourceQuota caps a whole namespace. It can limit the sum of
requests.cpu and requests.memory, the number of
PersistentVolumeClaims and their total storage, and the number of LoadBalancer Services
with services.loadbalancers. [8] That last one
turns a forgotten load balancer into a failed deploy instead of a monthly charge.
apiVersion: v1
kind: ResourceQuota
metadata:
  name: team-payments
  namespace: payments
spec:
  hard:
    requests.cpu: "40"
    requests.memory: 80Gi
    persistentvolumeclaims: "20"
    requests.storage: 2Ti
    services.loadbalancers: "2"
Know the edges before you roll them out:
- LimitRange checks happen "only at Pod admission stage". Existing pods "continue unchanged". [7]
- With a CPU or memory quota in place, pods must set requests or limits, or "the quota system may reject pod creation". Pair every quota with a LimitRange. [8]
-
Both reject violations with HTTP
403 Forbidden. [7] [8] Tell teams before you turn them on, and check usage withkubectl describe quota. [8] - Two LimitRanges in one namespace make the applied default "not deterministic". Keep one. [7]
- In the office
- A standard desk size for anyone who doesn't ask, and a desk budget per team that the front desk enforces.
- In the cluster
- LimitRange for per-container defaults and bounds, ResourceQuota for per-namespace totals, including storage and load balancers.
09 / The playbook
What is the cut plan, step by step?
Order matters. Clean up the obvious first, change requests before nodes, and lock it in last. Each step has a check before you move on.
Figure 2 · The cut plan, with the check for each step
- 1. Measure and assign owners DoRequests against usage per namespace, cost per namespace and team label in OpenCost. CheckEvery namespace has an owner, and you have a baseline cost and idle split.
- 2. Delete what nobody owns DoIdle namespaces, Released volumes, LoadBalancer Services with no backends, after the owner confirms. CheckCloud console shows the disks and load balancers gone, not just the Kubernetes objects.
- 3. Run VPA in Off mode DoOne VPA per workload, bounded with minAllowed and maxAllowed. Wait through a full business cycle. CheckRecommendations are stable from week to week.
- 4. Lower requests on a few workloads DoSet requests near the target, never below the lower bound, through your normal deploy path. CPU first. CheckNo rise in throttling, OOMKills, restarts or latency for a week.
- 5. Turn on consolidation with budgets DoConsolidation policy, consolidateAfter and a small budget. Fix PDBs that block every eviction. CheckNode count falls, no pods stay Pending, and error rates hold through each drain.
- 6. Move tolerant work to spot DoSpot NodePool with many instance types, on-demand fallback, interruption handling on. CheckA test interruption drains cleanly and replicas cover the gap.
- 7. Lock it in DoLimitRange and ResourceQuota per namespace, a monthly cost report by team. CheckNext month's bill and node count match the plan, and the idle share stays down.
- Step 1. You can't cut what you can't attribute. Owners turn a cluster-wide number into a list of conversations.
- Step 2. The cheapest savings. Nothing running depends on an orphan, so the risk is low once the owner agrees.
- Step 3. Recommend before acting. A full cycle catches weekly peaks and month-end jobs.
- Step 4. Requests change first, on a few services. Memory cuts wait until CPU cuts have been quiet.
- Step 5. Now the freed space turns into fewer nodes. This is the step the bill notices.
- Step 6. Cheaper nodes for work that can lose a pod with a short warning.
- Step 7. Guardrails and a regular report, so the drift doesn't start again.
- The whole plan: clean up, recommend, right-size, consolidate, add spot, then lock it in. Each step waits for its check.
Two details in step 2. "Released" is a PersistentVolume phase, meaning its claim was
deleted. [5] And for a PV with Retain, deleting
the PV object doesn't delete the disk, so finish the job in the cloud.
[5]
kubectl get pv                 # look for STATUS Released
kubectl get svc -A             # look for TYPE LoadBalancer
kubectl describe quota -n NAMESPACE- Lead with right-sizing and consolidation together. Neither saves much alone, as Figure 1 shows.
-
Use VPA in
Offmode as a recommender and apply its numbers through Git. Turn on automatic modes only for workloads that tolerate restarts, and only after a few quiet weeks. -
Start Karpenter consolidation with
WhenEmptyorBalancedand a small budget, then widen it once drains are uneventful. - Add spot last. It's real savings, but it adds a new failure mode, so do it once the rest is stable.
10 / Staying safe
What should you watch so savings don't become outages?
Lower requests and denser nodes mean less slack. Watch four signals, before and after every change.
| Signal | Why it happens | Metric |
|---|---|---|
| CPU throttling | The container hits its CPU limit. [1] |
container_cpu_cfs_throttled_periods_total over
container_cpu_cfs_periods_total [17]
|
| OOMKills | Memory use passes the limit. [1] |
kube_pod_container_status_last_terminated_reason{reason="OOMKilled"}
[16] [35]
|
| Evictions | A node runs short and evicts pods using more than they request. [12] |
kube_pod_status_reason{reason="Evicted"}
[16]
|
| Pending pods | No node has room for a pod's requests. [2] |
kube_pod_status_phase{phase="Pending"}
[16]
|
# Share of CFS periods in which each container was throttled
rate(container_cpu_cfs_throttled_periods_total[5m])
  / rate(container_cpu_cfs_periods_total[5m])

# Containers whose last exit was an OOM kill
kube_pod_container_status_last_terminated_reason{reason="OOMKilled"}

# Restarts in the last hour
increase(kube_pod_container_status_restarts_total[1h])
The eviction row is the subtle one. Under node pressure, the kubelet first evicts
BestEffort or Burstable pods "where the usage exceeds
requests". [12] So a request cut too low doesn't just risk
an OOM kill. It also puts the pod first in line when a packed node runs short. Pods are
Guaranteed only when every container's requests equal its limits for both
CPU and memory. [11]
Common mistakes
- Cutting to the average. Requests set to average usage leave no room for peaks. Use a high percentile, and stay at or above VPA's lower bound.
- Cutting memory like CPU. Too little CPU means slower; too little memory means killed. [1] Move memory in smaller steps.
- Tight CPU limits after right-sizing. A low limit throttles even when the node has idle CPU. [1] Watch throttling on every service whose limit moved.
- PDBs that allow nothing. They quietly block consolidation, and the bill doesn't fall. [28]
- Spot for singletons. One replica on spot means an outage on every reclaim.
- Measuring a quiet week. A month-end batch job or a seasonal peak can need far more than the recommendation from a quiet fortnight.
Watch cost too. The OpenCost idle split should shrink after step 5, and the node count should follow the requests line down. If requests fall but nodes don't, consolidation is blocked; check the node events. For a deeper look at building the monitoring stack itself, the Kubernetes observability guide covers it.
- In the office
- After shrinking bookings, check that nobody is standing in the corridor, nobody was asked to leave, and no team is working cramped.
- In the cluster
- Watch throttling, OOMKills, evictions and pending pods next to node count and idle cost.
Keep these names
A small glossary
- Request
- The CPU or memory a container says it needs. The scheduler places pods by requests.
- Limit
- The most a container may use. CPU over the limit is throttled; memory over it can be OOM-killed.
- Allocatable
- The part of a node's capacity available to pods, after system reservations.
- Bin packing
- Fitting pods onto as few nodes as possible, by their requests.
- Consolidation
- Karpenter removing or replacing nodes whose pods can run elsewhere, to cut cost.
- Disruption budget
- A NodePool limit on how many nodes Karpenter may disrupt at once.
- PodDisruptionBudget (PDB)
- A limit on how many of an app's pods voluntary disruptions may take down at once.
- VPA
- Vertical Pod Autoscaler: recommends, and optionally applies, container requests.
- Cluster idle and workload idle
- Node capacity nobody requested, and requested capacity nobody used (OpenCost terms).
- Spot capacity
- Discounted spare cloud machines that the provider can reclaim with short notice.
- LimitRange and ResourceQuota
- Per-container defaults and bounds, and per-namespace totals.
Check the concept
Can you explain it back?
1. A node shows 15% CPU usage, but a new pod stays Pending. How?
The scheduler checks the sum of requests against allocatable, not live usage. If requests already fill the node, it refuses the pod however idle the node is.
2. You halved every request, but the bill didn't move. Why?
Lower requests free space on nodes, but the nodes still run. Savings come when consolidation packs pods together and removes the empty nodes.
3. Why start VPA in Off mode?
Off mode only calculates recommendations. You can review the target and bounds over a full business cycle and apply them through your normal deploy path, with no evictions.
4. Karpenter is on, requests are lower, yet one node never goes away. Where do you look?
At the node's events. A PDB that allows no evictions, a do-not-disrupt
pod, or preferred anti-affinity can each keep a node out of consolidation.
5. Why can a request cut too low lead to evictions, not just OOM kills?
Under node pressure, the kubelet evicts pods whose usage exceeds their requests first. A low request makes a pod an early candidate.
Continue the thread
More on running Kubernetes well
- Kubernetes observability in 2026. How to build the metrics, logs and traces stack that the checks in this guide depend on, and keep its cardinality under control.
- AI FinOps and token tracking. The same habit of attributing cost to an owner, applied to AI usage.
- Kubernetes certificates and TLS. What the control plane does behind the scenes to keep a cluster secure.
- NVIDIA NVKE, explained. How GPU owners turn their machines into Kubernetes clusters for customers.
Read further
Sources
All accessed 20 November 2026. Kubernetes docs are the live pages for the current release; VPA, OpenCost, kube-state-metrics and cAdvisor files are pinned to the commit read that day. Karpenter docs are v1.15, marked latest on that day.
- Kubernetes docs: Resource Management for Pods and Containers
- Kubernetes docs: Kubernetes Scheduler
- Kubernetes docs: Reserve Compute Resources for System Daemons
- Kubernetes docs: DaemonSet
- Kubernetes docs: Persistent Volumes
- Kubernetes docs: Service
- Kubernetes docs: Limit Ranges
- Kubernetes docs: Resource Quotas
- Kubernetes docs: Resize CPU and Memory Resources assigned to Containers
- Kubernetes docs: Feature Gates (InPlacePodVerticalScaling)
- Kubernetes docs: Pod Quality of Service Classes
- Kubernetes docs: Node-pressure Eviction
- Kubernetes docs: Disruptions
- Kubernetes docs: Kubernetes Metrics Reference
- Kubernetes docs: kubectl top pod
- kube-state-metrics: Pod metrics, commit 703c8f4
- cAdvisor: Prometheus metrics, commit ddc2d54
- metrics-server README
- Prometheus docs: Query functions
- OpenCost specification, commit 31361dd
- OpenCost docs: API, commit 31361dd
- OpenCost docs: API examples, commit 31361dd
- Vertical Pod Autoscaler README, commit 9e1274b
- VPA docs: Quick start, commit 9e1274b
- VPA docs: Features, commit 9e1274b
- VPA docs: Known limitations, commit 9e1274b
- VPA docs: API reference, commit 9e1274b
- Karpenter docs: Disruption (v1.15)
- Karpenter docs: NodePools (v1.15)
- Karpenter docs: Scheduling (v1.15)
- Amazon EC2 User Guide: Spot Instance interruption notices
- Amazon EC2 User Guide: Spot Instance interruptions
- Google Cloud: Compute Engine Spot VMs
- Google Cloud: Spot VMs in GKE
- Kubernetes docs: Assign Memory Resources to Containers and Pods
Written with AI assistance. Every technical claim was checked against the original sources listed above.